
NORCAL - USING REAS IN NORTHERN CALIFORNIA
|
In the Northern California or NorCal project, the REA Applications team was asked to consider how REA data might help quantitatively inform Land Health Standards for an area originally centered around the Twin Peaks allotment in Eagle Lake Field Office. After the original question, further management questions were forthcoming about burrowing owl, mule deer, pronghorn, wildfire and trails. While the allotment was covered by two REAs (Northern Great Basin, Central Basin and Range), neither REA actually covered the full area of interest (see map right). So instead we were able to use the science concepts, methods, and nation-wide or west-wide broad scale data sets from the REAs and extend them into NorCal using GIS data and REA models to answer the analysis questions. The advantage to this approach was that we still considered the science basis that has been peer-reviewed by BLM in the REAs. As the project continued and was extended into other management questions, we considered other sources of peer reviewed literature and data sets. |
 |
|
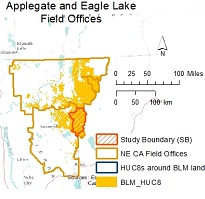
To inform the Land Health Standards for NorCal, we needed to consider the characteristics of the surrounding area or the context of the allotment. Identifying boundaries is an important part of the Landscape Approach and broad scale analysis. Boundaries are typically question or topic specific and will often disregard geopolitical or administrative boundaries. Boundaries may be identified using watersheds, ecoregions, or other physiographic provinces. (See field offices and study boundary map left). |
|
A popular option within the REAs was to identify a relevant level 3 ecoregion and buffer it by selecting HUC 10 (5th field HUC) or HUC 12 (6th field HUC) watersheds surrounding it (see map right). This process can also be used to identify smaller extents using level 4 ecoregions. The REAs all use Omernik’s ecoregions and the NorCal analysis is consistent with this decision. |
 |
Links to presentations that show the analyses processes and results: