
USING REA DATA IN THE NORTHERN GREAT BASIN
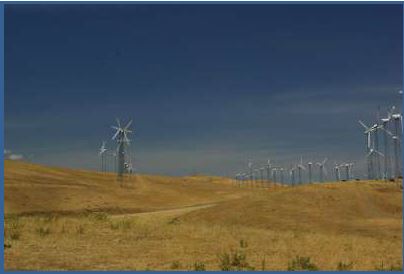
This analysis was demonstrated in the Northern Great Basin (NGB) REA workshop (2015). The analysis steps could be generalized and applied to other management questions (MQs) and REAs
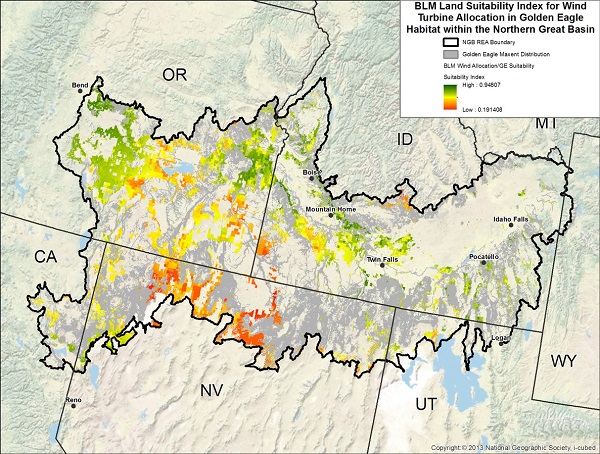
MQ: where are the best places on BLM managed lands in the NGB to locate wind turbines that will have a limited effect on golden eagles?
1. Determine the analysis type:
- Binary analysis identifies “good” or “bad” potential areas only.
- Suitability Index Analysis rates potential areas along a range of values.
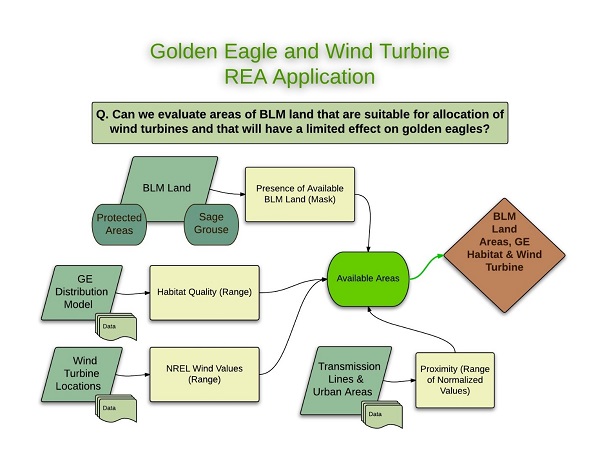
2. Determine what data sets are needed and develop a conceptual model diagram to express the data and linkages between them. Does the REA contain all necessary data? Can BLM or other data sources provide data sets not present in the REA? Are there local data sets of good quality? Are there data gaps and limitations that should be noted?
Suitability Index Analysis was used to locate and rate potential areas to place wind turbines in relation to golden eagle habitat. The conceptual model is below. All data sets used can be found in the NGB REA.
3. Find and visualize the data in ArcMap:
- Check out how to find REA data - these resources explain how to find REA data on the BLM network (BLM only) or on the Landscape Approach Data Portal
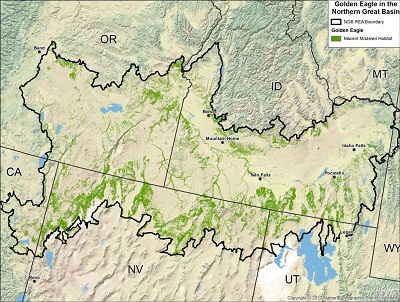
Golden Eagle: Maxent modeled habitat |
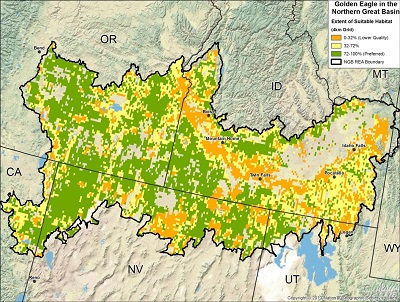
Golden Eagle: potential suitable habitat |
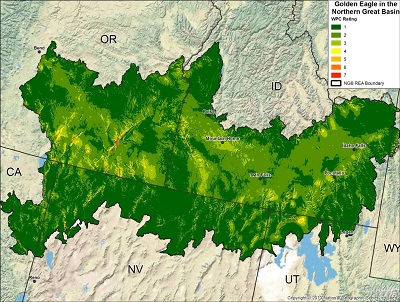
Wind power class (NREL) |
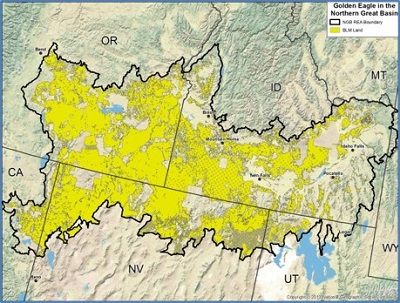
Land managed by BLM |
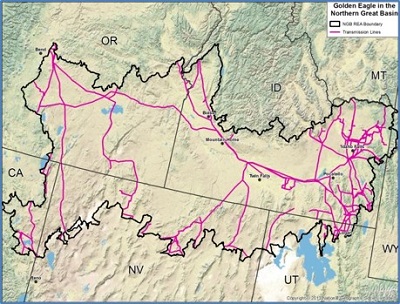
Transmission Lines |
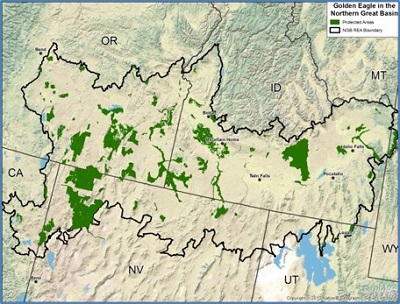
Protected Areas |
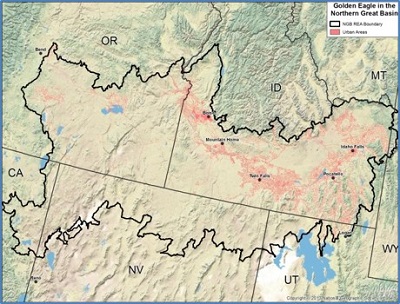
Urban Areas |
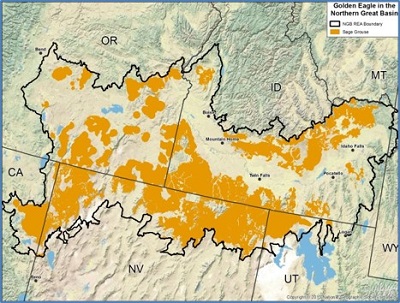
Greater sage-grouse: preliminary priority habitat |
4. Is your MQ already answered in the REA? If not, build the model or script to process the data - here is an example in ArcGIS ModelBuiler:
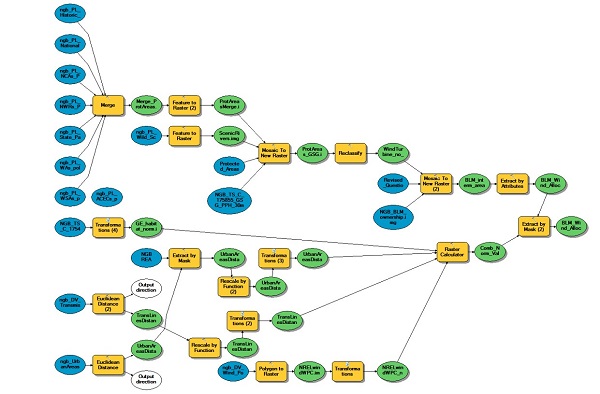
5. In the model protected areas and sage-grouse PPH are combined to indicate areas where wind turbines should not be located. Proximity to transmission lines and urban areas are advantageous conditions when locating wind turbines. Golden Eagle modeled habitat and potential suitable habitat are combined to indicate where wind turbines should not be located. These three conditions are merged to indicate a range of locations that are more or less suitable to locate wind turbines on BLM managed land. See Suitability Index map below. Green indicates areas that are more suitable to locate wind power facilities; red areas are less suitable. Green areas should be investigated further to determine actual locations and to investigate any issues not accounted for in this analysis.
Discussion:
- This question is a good example of analysis using the interaction of a conservation element (Golden Eagle) with a change agent (energy development) to answer a management question at the broad scale.
- It is critical to understand the data gaps and science gaps when using REA data:
- This data does not account for existing wind farms – Field Offices may be able to provide this data for their area of interest (AOI)
- Greater sage-grouse PPH data were included and the areas excluded from the potential wind power areas. This addition to the original analysis was based on feedback from the Field Office
- Limitations and strengths must be identified in any analyses:
- The analysis doesn’t account for visual resource concerns; viewshed data for the AOI could be added
- Weighting can be altered to emphasize proximity to urban areas or existing transmission lines
Broader Discussion about the process, REAs, and management
- Multiple methods are available for analyses so it may be worth checking various REAs for different processes
- This method was relatively quick and easy to implement in Model Builder or Python - both interface with ArcGIS
- This method provided broad results over a coarse scale - this will not work for locating individual turbines but rather points to areas that should be investigated at finer scale
- This method is meant to help find and prioritize management options in a quantifiable and defensible manner
- Adjusting model thresholds allows flexibility in modifying the model by e.g. distance to urban areas or transmission lines
- This methodology can be generalized and used to answer other questions, for example, where are the best places to locate turbines/roads/campgrounds while minimizing the effects on species A or B or a certain vegetation community. Consider how you might quantify conditions and thresholds important to the species of concern.
Click to access the NGB presentation which includes the analysis shown above (slide 14) and further information on using REA data.